Bonk has been on the radar of many crypto enthusiasts since its explosive debut. After a period of steep decline, this Solana-based meme token has started to show signs of life once again. In this post, we’ll delve into Bonk’s price chart, analyze key support and resistance levels, and discuss scenarios for a potential new all-time high. Please note that this analysis is for educational purposes only and should not be taken as financial advice.
Bonk’s Market Structure and Recent Price Action
The U-Shaped Bottom: A Gradual Shift in Sentiment
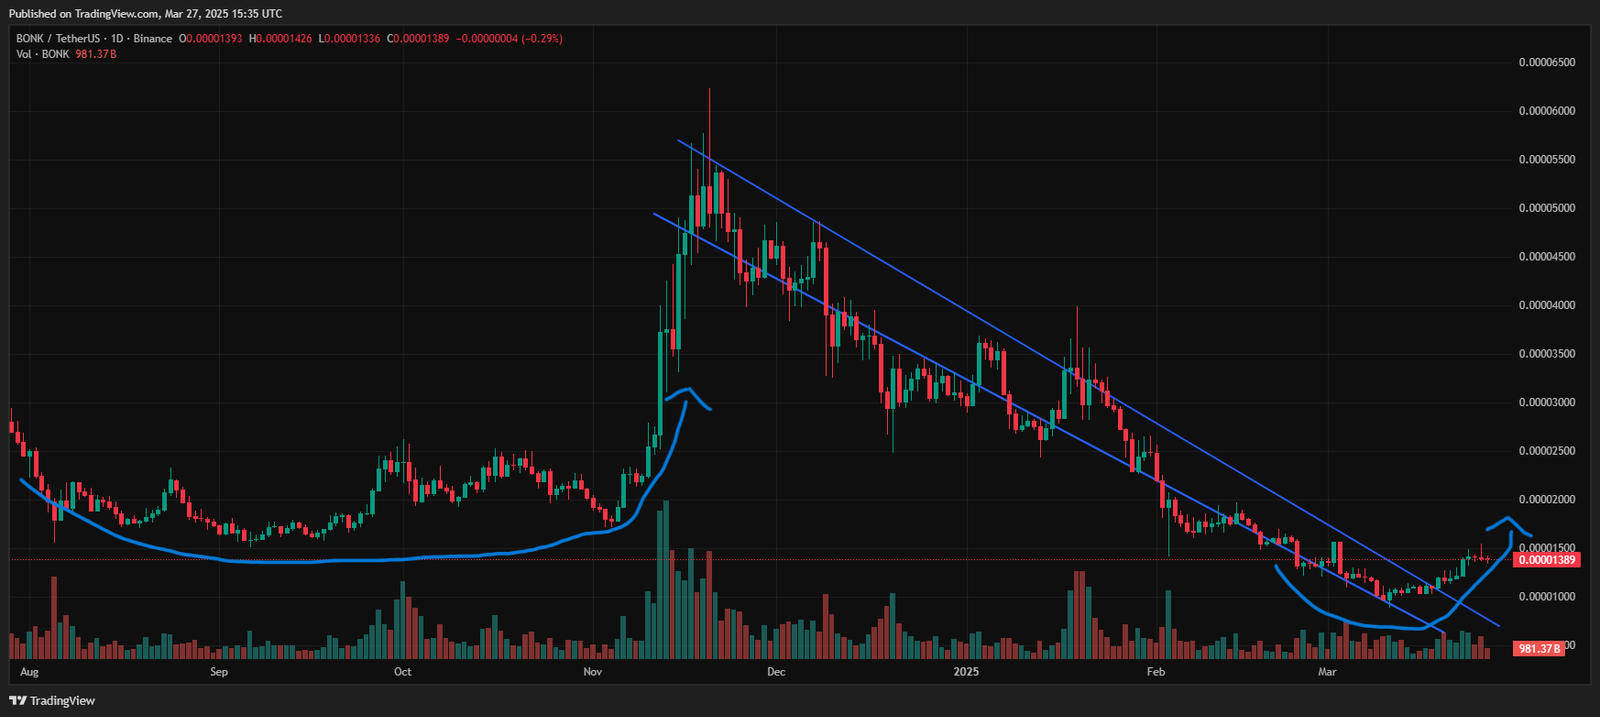
Over the past few weeks, Bonk has exhibited a U-shaped bottom on the price chart, reflecting a transition from heavy selling pressure to steady accumulation. This pattern is often interpreted as a bullish signal because it indicates that buyers are gradually regaining control. Historically, such formations can precede strong upward movements, as the coin’s supply on the market diminishes while demand picks up momentum.
In Bonk’s case, the U-shaped bottom becomes even more significant when considering its previous price history. The last time Bonk formed a rounded bottom, it eventually soared to an all-time high. Traders and investors who track pattern recognition may see this as a sign that Bonk could be on the cusp of another breakout.
Breakout from the Descending Channel
One of the most noteworthy technical developments on Bonk’s chart is its breakout from a descending channel that had constrained price action for several weeks. Descending channels often signal a downtrend, with lower highs and lower lows. When an asset breaks above the upper boundary of this channel, it suggests a potential trend reversal.
On the Bonk chart, this breakout coincided with a spike in trading volume, signaling strong buying interest. A volume uptick during a channel breakout is often considered a robust bullish confirmation. If this momentum persists, Bonk may be gearing up for a more sustained upward move.
Key Support Levels

Primary Support at 0.00001
The most critical support level to watch is around 0.00001. This price zone has proven to be a strong foothold for Bonk. On multiple occasions, buyers have stepped in aggressively whenever the price approached this region, preventing further declines. If Bonk experiences another short-term pullback, it is highly likely that 0.00001 will remain a major support level.
Below 0.00001, the next possible support could emerge around 0.000008, but the chart suggests that buyers have been confident in defending 0.00001, making it a formidable floor. If Bonk were to lose this support, it might signal a deeper correction, although that scenario appears less likely in the near term given the recent bullish shift.
Key Resistance Levels
Immediate Resistance Around 0.000015
The first major resistance that Bonk faces is in the 0.000015 region. Historically, the price has struggled to break above this level, indicating a concentration of sell orders. If Bonk manages a daily close above 0.000015, it would be a strong indication that bullish momentum is intensifying. Traders might look for a retest of this area as support after a breakout to confirm the move’s legitimacy.
Secondary Resistance at 0.00002
Beyond 0.000015, the next important hurdle lies around 0.00002. A break and hold above this mark could trigger a wave of FOMO (Fear of Missing Out), drawing more buyers into the market. This psychological round number often attracts attention and can be a catalyst for higher trading volume.
Eyeing the All-Time High Zone
If Bonk can conquer these lower resistance zones, the final boss on the chart is the previous all-time high, located roughly in the 0.00004 region (depending on which exchange data you consult). A sustained rally above 0.00002 would put this level within reach. As we’ve seen in the past, once momentum and hype align for meme tokens, the surge to all-time highs can be rapid.
Indicators Supporting the Bullish Narrative

Volume Profile
The volume profile in recent sessions has shown increased participation whenever Bonk dips toward 0.00001. This pattern highlights accumulation by traders and investors who believe in the coin’s upside potential. A spike in volume during breakouts from key chart patterns often provides confirmation that buyers are willing to drive the price higher.
Moving Averages
While shorter-term moving averages (such as the 20-day and 50-day) have been sloping downward due to the extended decline, they have recently started to flatten out. If the price can stay above these moving averages and they begin to slope upward, it will reinforce the bullish outlook. A moving average crossover could attract additional traders looking for technical confirmation.
Scenarios for a New All-Time High
Bullish Scenario
- Sustained Breakout: Bonk remains above the 0.00001 support level and continues to close above the upper boundary of the former descending channel.
- Climbing Above Resistances: The token successfully breaks through the 0.000015 and 0.00002 resistance zones, confirming a new uptrend.
- Increased Volume & Hype: As Bonk gains traction, media coverage and social media chatter could intensify, driving more speculative interest.
- Test of All-Time High: With enough momentum, Bonk could retest the previous all-time high near 0.00004. A decisive break above this zone could open the door for price discovery and a potential surge to uncharted territory.
Bearish Scenario
- Failure at Resistance: If Bonk struggles to overcome the 0.000015 resistance and falls back into the descending channel, it may signal waning bullish momentum.
- Loss of Key Support: A drop below 0.00001 could trigger a cascade of sell orders, pushing the price toward lower support around 0.000008 or even lower.
- Reduced Volume: Without strong trading volume, Bonk might drift sideways or trend downward, failing to capitalize on the recent breakout.
Timeframe Considerations
Predicting when Bonk will make a new all-time high is challenging, as market dynamics can shift rapidly. However, the presence of a U-shaped bottom, combined with the breakout from a descending channel, suggests that Bonk could see a strong rally in the coming weeks if market conditions remain favorable. Traders should keep an eye on daily and weekly closes above resistance levels to confirm the strength of any upward move.
Final Thoughts
Bonk’s chart is showing early signs of a bullish turnaround, highlighted by a U-shaped bottom, breakout from a descending channel, and strong support at 0.00001. These technical signals indicate that market sentiment is shifting, and buyers are beginning to accumulate. The next hurdles lie at 0.000015 and 0.00002, levels that, once surpassed, could propel Bonk toward its previous all-time high near 0.00004.
While these indicators are promising, it is essential to remember that meme tokens like Bonk can be highly volatile. The journey to a new all-time high will likely involve periods of consolidation and possibly short-term retracements. As always, conducting thorough research and risk management is crucial. Keep an eye on volume spikes, moving averages, and support/resistance retests for confirmation of a sustained bullish trend.
Disclaimer: This content is for educational and informational purposes only. It should not be construed as financial advice. Always do your own research and consult with a professional before making any investment decisions.


