In today’s volatile crypto market, few assets attract as much attention as Shiba Inu (SHIB). As an altcoin that has captured the imagination of both retail investors and seasoned traders, Shiba Inu’s technical chart tells a story full of tension and possibility. In this comprehensive blog post, we will delve into the critical support level that SHIB is currently testing, examine the technical indicators that point to a pivotal moment, and analyze potential scenarios—whether the asset breaks down further or rallies for a bullish breakout. You can view the live chart analysis on TradingView by clicking here.
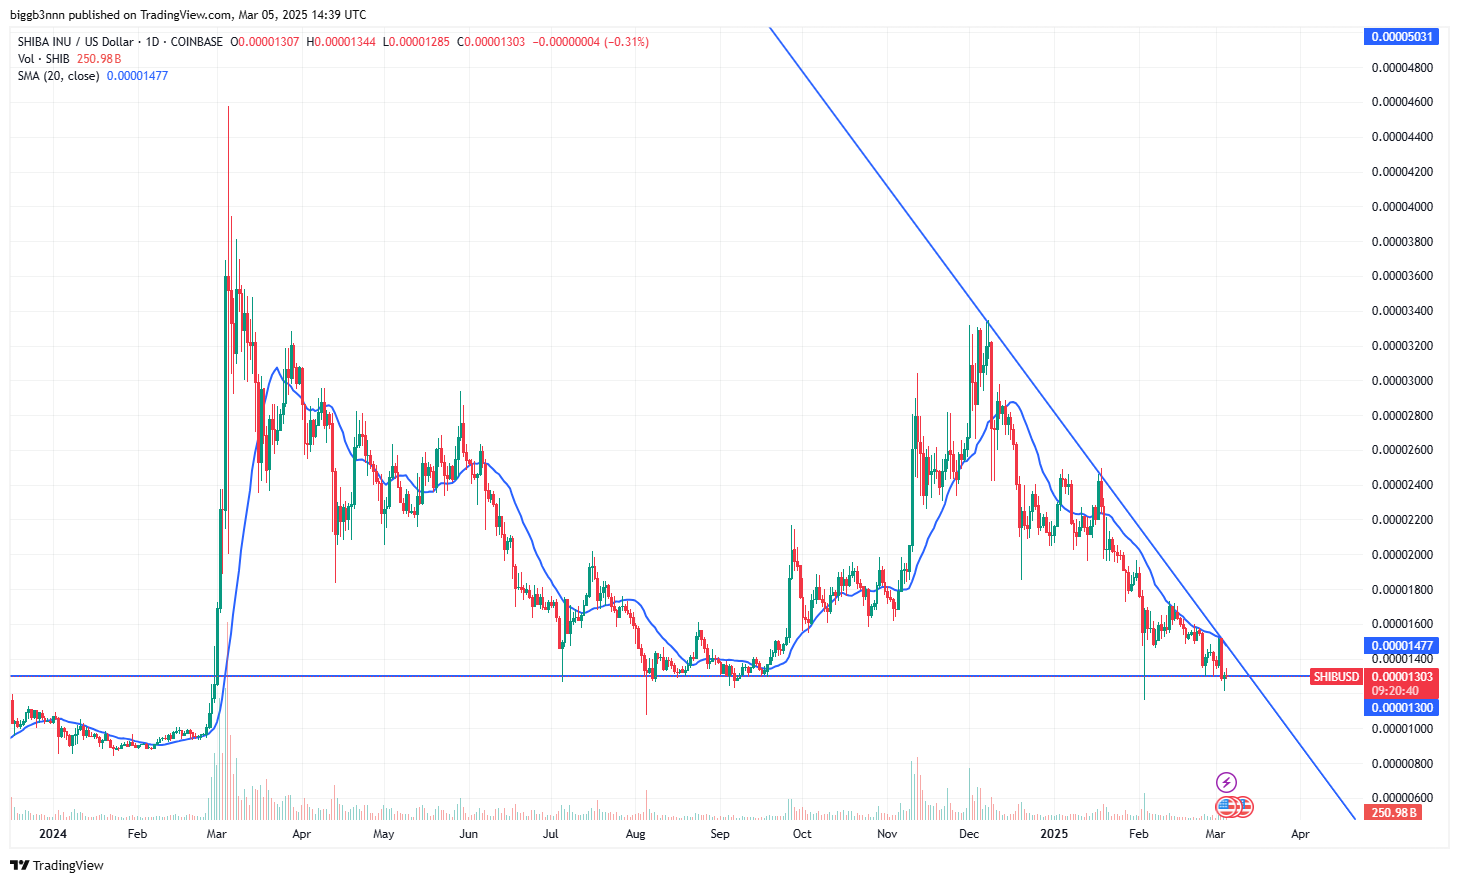
Shiba Inu (SHIB) Technical Analysis – March 5, 2025
Current Price: $0.00001305
Key Support: $0.00001300 – $0.00001305
Key Resistance Levels: $0.00001477 (20-day SMA), Downtrend Resistance
Market Structure & Price Action
SHIB is currently testing a major historical support zone around $0.00001300 – $0.00001305 on the daily timeframe. This level has acted as a crucial price floor in the past, preventing further downside. However, the chart shows a strong downward trend, with price continuously respecting the descending trendline.
Additionally, SHIB is trading below the 20-day Simple Moving Average (SMA), reinforcing the bearish pressure. This suggests sellers remain in control unless bulls can stage a breakout above resistance levels.
Scenario 1: Break Below $0.00001300 Support
If SHIB fails to hold the critical support at $0.00001300, the next possible levels of support are significantly lower. A breakdown from this range could lead to:
- $0.00001000 – $0.00000950: A psychological and historical level where buyers may attempt a reversal.
- $0.00000750 – $0.00000600: If selling momentum intensifies, price could revisit deeper demand zones from 2023-2024.
A break below $0.00001300 could also trigger stop-loss liquidations, leading to a sharp downward move as panic selling ensues.
Scenario 2: Holding Support & Potential Bounce
If SHIB maintains the $0.00001300 support, we could see a relief bounce toward:
- $0.00001477 (20-day SMA): This moving average has acted as dynamic resistance. A reclaim would be the first sign of strength.
- $0.00001600 – $0.00001800: A breakout above the downtrend resistance could shift momentum in favor of bulls.
A successful hold of support combined with a volume increase could confirm accumulation, signaling a potential trend reversal.
Indicators & Market Sentiment
- Volume: Relatively low, indicating a lack of strong bullish commitment. A spike in volume near support would indicate strong buy interest.
- Trendline Resistance: Until SHIB breaks the downtrend line, the overall trend remains bearish.
- RSI & MACD (Not Visible on Chart): If RSI shows oversold conditions and MACD starts curling upward, it could support the bounce scenario.
Risk Management and Trading Strategies
Regardless of whether SHIB breaks down or breaks out, effective risk management and well-planned trading strategies are essential for navigating the market. In this section, we outline several strategies to help traders manage risk and position themselves advantageously in either scenario.
A. Setting Stop-Loss and Take-Profit Levels
One of the cornerstones of risk management is the strategic placement of stop-loss and take-profit orders. These orders help limit potential losses while ensuring that profits are locked in when the market moves favorably.
Guidelines for Stop-Loss Orders
- Below the Support Level:
For a long position, it is advisable to place stop-loss orders slightly below the critical support level. This minimizes potential losses if the asset indeed breaks down. Setting the stop-loss too tight, however, can lead to premature exits in volatile conditions. - Technical Indicators:
Use the technical indicators discussed earlier to determine a safe buffer below the support level. For example, if the price has historically bounced at a certain level, setting the stop-loss just below that point can be a prudent move. - Position Size Considerations:
The distance of the stop-loss relative to your entry point should align with your overall risk tolerance and the size of your position. Smaller positions might allow for tighter stops, while larger positions may require a more generous buffer.
Defining Take-Profit Levels
- Historical Resistance:
Identify key resistance levels where the asset previously struggled to break through. These levels can serve as targets for taking profits once a breakout occurs. - Risk-Reward Ratio:
Establishing a favorable risk-reward ratio is essential. Many seasoned traders aim for a risk-reward ratio of at least 1:2, meaning that the potential profit should be at least twice the potential loss. - Trailing Stops:
Consider using trailing stops as a way to secure gains during a breakout. Trailing stops automatically adjust as the price moves in your favor, ensuring that profits are captured even if the market reverses unexpectedly.
Position Sizing and Diversification
Proper position sizing is fundamental to managing risk in any trading strategy. Diversification across different assets further reduces exposure to the volatility of any single cryptocurrency.
Position Sizing Strategies
- Fixed Fractional Position Sizing:
A common approach is to risk only a small percentage of your trading capital on a single trade. This method ensures that no single loss can significantly impact your overall portfolio. - Volatility-Based Sizing:
Adjust your position size based on the asset’s volatility. Higher volatility may require smaller positions to mitigate risk, while lower volatility might allow for larger positions. - Capital Allocation:
Ensure that your capital is allocated in a way that reflects your risk tolerance and market outlook. Avoid overexposure to one asset, even if it shows promising technical signals.
Benefits of Diversification
- Spread Risk:
Diversifying your investments across various assets can help mitigate the risk associated with any one particular market move. Even if SHIB experiences significant volatility, other assets in your portfolio may offer stability. - Opportunities for Hedging:
Diversification allows for the possibility of hedging positions. For instance, if you hold positions in assets that typically move inversely to each other, gains in one can offset losses in the other. - Balanced Portfolio:
A diversified portfolio is more likely to withstand market turbulence. The crypto market is highly dynamic, and spreading risk across multiple assets is a smart strategy for long-term investors.
Monitoring and Adjusting Strategy
The crypto market is notorious for its rapid changes. Continuous monitoring and the ability to adjust your trading strategy are critical components of successful trading.
Regular Monitoring
- Real-Time Alerts:
Set up alerts for key technical levels on platforms like TradingView. These alerts can notify you when the price approaches critical support or resistance levels, allowing you to take timely action. - Daily and Weekly Reviews:
Regularly reviewing both daily and weekly charts helps in understanding the evolving market dynamics. Daily reviews provide insights into immediate price action, while weekly reviews reveal longer-term trends. - Indicator Tracking:
Keep a close eye on the technical indicators discussed earlier. A sudden change in the RSI, MACD, or volume patterns can signal a shift in market sentiment, prompting a re-evaluation of your positions.
Adjusting Your Strategy
- Reacting to New Data:
Be prepared to adjust your stop-loss orders, take-profit levels, and position sizes based on new market data. Flexibility is key in a volatile market. - Learning from Market Behavior:
Every market movement provides valuable insights. Analyze how the asset behaves around the critical support level and use that information to refine your trading strategy. - Rebalancing Your Portfolio:
Regularly review and rebalance your portfolio to ensure that it aligns with your risk tolerance and market outlook. This practice helps in maintaining a balanced exposure across different assets.
Final Thoughts
SHIB is at a make-or-break level. A confirmed break below $0.00001300 could lead to a deeper selloff toward $0.00001000 and lower levels, while holding this level may result in a short-term bounce toward $0.00001477 and above. Bulls need to reclaim the descending trendline to signal a trend reversal.
Traders should watch for volume confirmation and candlestick patterns around this support zone for the next move.
Disclaimer: The content provided in this post is based on current technical analysis and historical price data. It does not constitute financial advice, and all trading decisions should be made after conducting your own research and consulting with a professional advisor.