
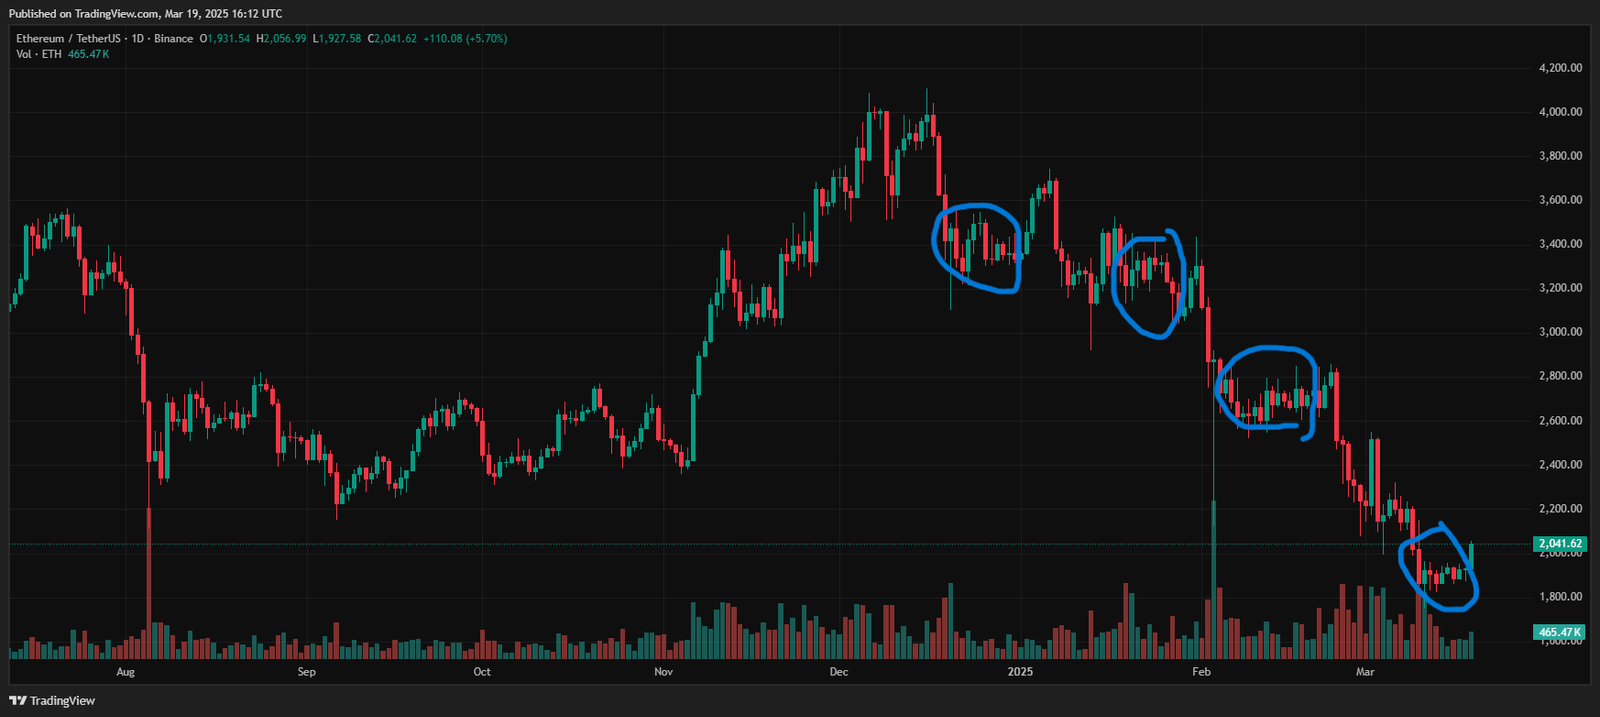
Ethereum (ETH), the second-largest cryptocurrency by market cap, has once again captured the spotlight with an impressive 8% rally, pushing its price from the $1,810 support zone up to around $2,036 at the time of writing. This surge has come as a relief to many traders and investors who have watched ETH languish in a downward or sideways trend over the past 14 months. Each time the coin has tried to break out, it has faltered, falling back and forming what is commonly referred to as a “bull trap.”
Now, the question on everyone’s mind is whether this latest pop in Ethereum’s price is a sign of a sustainable upturn or simply another trap waiting to ensnare optimistic buyers. In this blog post, we will conduct a detailed technical analysis of Ethereum’s chart, focusing on its price action, key support and resistance levels, and crucial on-chain metrics.
We will also explore the possibility of a bullish breakout that could push ETH to new heights, as well as the downside risks if this pop fails once again. By the end, you will have a clearer understanding of where Ethereum might be heading next—and the indicators to watch for clues on whether this rally has legs or not.
The Current State of Ethereum
Over the last 24 hours, Ethereum has jumped approximately 8.49%, landing at about $2,044.92 at the time of writing. The coin managed to hold the critical $1,810 support area, which has historically acted as a strong floor during previous dips.
This bounce from $1,810 to $2,036 is not the first time Ethereum has attempted to reverse its fortunes. Throughout the past year and a half, we have seen multiple short-lived rallies that ultimately fizzled out, dragging ETH back to lower lows or retesting previous supports.
In terms of market capitalization, Ethereum remains the undisputed leader in the altcoin space, sitting at a $246.7 billion valuation. Its daily trading volume stands at around $15.44 billion, indicating significant liquidity. Nonetheless, high liquidity alone does not guarantee a sustained rally. Market sentiment and technical indicators play equally crucial roles in determining the longevity of any price movement.
Bull Trap Concerns
A bull trap occurs when a market shows signs of breaking out of a downtrend or consolidating pattern, only for the rally to fail abruptly, leading to a rapid decline that catches bullish traders off guard. Ethereum has repeatedly exhibited such behavior over the past 14 months. After each promising upward thrust, the coin encountered strong selling pressure, wiping out gains and often forcing the price to revisit or break below key support zones.
With the current pop to $2,036, skeptics wonder if history will repeat itself. The presence of repeated bull traps can foster a sense of caution among traders, causing them to hesitate before entering new positions. However, each bull trap scenario is unique, influenced by evolving market conditions, on-chain data, and macroeconomic factors. Evaluating whether this rally differs from previous ones requires a deep dive into Ethereum’s technical indicators, volume trends, and on-chain metrics.
Key Support and Resistance Levels
The $1,810 level has proven to be a vital support for Ethereum. Each time ETH has approached or briefly dipped below this area, buyers have stepped in to defend it. This consistent defense suggests that market participants view $1,810 as an attractive entry point, or at least as a line in the sand they are not willing to let ETH cross easily.
If the current rally fails and ETH returns to test $1,810 again, it will be crucial to see if the level holds. A decisive break below it could open the door to lower support zones in the $1,600–$1,700 range, potentially leading to a more extended correction. On the other hand, if Ethereum finds robust buying pressure near $1,810 again, it might strengthen the argument for a larger bullish rebound.
Overhead Resistance Around $2,200–$2,300
Looking upward, Ethereum’s first major resistance appears to lie between $2,200 and $2,300, an area where the coin has previously struggled to maintain momentum. If ETH can push through this zone on strong volume, it would signal a break from its recent pattern of failed rallies. A successful breach of $2,300 could then target the $2,500 region or higher, depending on broader market sentiment and macroeconomic conditions.
Potential Upper Targets
If Ethereum were to stage a full-fledged recovery, some analysts point to $2,800–$3,000 as a longer-term target. However, reaching those levels would require a sustained bullish narrative, high trading volume, and likely a tailwind from the overall crypto market. Ethereum’s history of sharp rallies suggests that once momentum picks up, the coin can climb quickly. But each move must be supported by fundamental and on-chain factors to avoid another bull trap scenario.
Volume Analysis: Is This Move Real?
Volume is a key indicator that can help distinguish between a genuine breakout and a bull trap. High volume during a price surge usually indicates strong market conviction. Conversely, if a price spike occurs on low volume, it may suggest that the rally is driven by a small group of buyers or short covering rather than widespread market participation.
Recent Volume Trends
Ethereum’s daily trading volume, currently around $15.44 billion, is substantial but not exceptional compared to the massive spikes seen during previous market peaks. For ETH to maintain its upward trajectory, we would ideally see volume levels rise in tandem with the price. If volume tapers off while the price climbs, it could indicate that the rally is running out of steam, increasing the risk of another swift reversal.
Spot vs. Derivatives Markets
It is also worthwhile to examine how much of Ethereum’s trading volume stems from spot markets versus derivatives like futures and options. A rally driven primarily by derivatives could be more prone to liquidations and sudden reversals, especially if leveraged traders get caught on the wrong side of the move. Spot-driven rallies, on the other hand, often reflect more organic buying, which can be more sustainable.
On-Chain Metrics
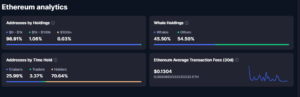
According to the provided data, whales—large investors who hold significant amounts of ETH—control about 45.50% of Ethereum’s circulating supply. This concentration of holdings can be a double-edged sword. On the one hand, if whales remain confident and continue to accumulate, they can support the price and help spark a bullish run. On the other hand, if whales decide to offload their holdings, the market could face substantial selling pressure, making a price reversal more likely.
Addresses by Holdings
- $0–$1k: 98.91%
- $1k–$100k: 1.06%
- $100k+: 0.03%
The vast majority of addresses hold relatively small amounts of ETH, underscoring Ethereum’s broad retail participation. While 0.03% of addresses may seem minuscule, these are likely large investors or institutions that can significantly influence price action.
Addresses by Time Held
- Holders (70.64%): These are long-term investors who have held ETH for a considerable period. They often remain unfazed by short-term fluctuations.
- Cruisers (25.99%): Addresses that hold for a moderate timeframe, typically awaiting favorable market conditions.
- Traders (3.37%): Addresses that move in and out quickly, adding short-term volatility to the market.
A high percentage of long-term holders (over 70%) can provide stability, as these addresses are less likely to panic sell on minor dips. However, if sentiment deteriorates significantly, even a fraction of these holders deciding to exit can amplify downward pressure.
Is This Another Bull Trap or a Real Breakout?
A bull trap typically features:
- A Sudden Price Surge: The market quickly moves higher, luring in buyers who fear missing out on the next big rally.
- Low or Declining Volume: The surge may not be supported by strong volume, suggesting that the move could be short-lived.
- Failure at Key Resistance: Once the coin reaches a known resistance area, selling pressure resurfaces, reversing the gains.
Ethereum’s 8% pop to around $2,036 does raise some concerns about a potential bull trap. The coin is moving higher, but it remains below key overhead resistance in the $2,200–$2,300 region. If the price stalls and volume diminishes before breaking that zone, there is a risk of a sharp pullback.
Signs of a Genuine Breakout
For Ethereum to confirm that this rally is more than just another trap, the following would be encouraging:
- High Volume on Up Moves: ETH needs strong participation from buyers. Watch for volume spikes that exceed recent averages, particularly during price increases.
- Successful Retest of Support: If Ethereum pulls back slightly but finds support at higher levels (e.g., $1,900 or $1,810), it would suggest buyers are stepping in more aggressively than before.
- Break Above $2,200–$2,300: Clearing this resistance on a daily or weekly closing basis would signal that ETH is finally escaping the grip of the past 14 months’ downtrend.
Future Scenarios: How Far Can ETH Go?
In a bullish scenario, Ethereum holds above $1,810 and builds on the current momentum, pushing through $2,200–$2,300 with strong volume. This move could pave the way for a run toward $2,500 or even $2,800. Such a rally would likely be fueled by positive on-chain signals (e.g., whales accumulating, an uptick in daily active addresses), as well as improving macroeconomic conditions and broader market optimism.
Moreover, Ethereum’s fundamental use cases in decentralized finance (DeFi), non-fungible tokens (NFTs), and various blockchain applications remain strong. Any major announcements regarding network upgrades, staking developments, or successful scaling solutions (like rollups or sharding) could also bolster sentiment, encouraging more capital inflows.
Bearish Scenario
In a bearish scenario, Ethereum fails to sustain its gains, with the rally stalling before or around $2,200–$2,300. If volume declines and sellers regain control, ETH could swiftly revisit the $1,810 support. A break below that critical level would likely trigger another wave of selling, potentially sending the coin into the $1,600–$1,700 zone or even lower.
Should a broader market downturn coincide with this failure, Ethereum might struggle to find a stable floor. While the high percentage of long-term holders provides some cushion, persistent negative sentiment could push even patient investors to reduce their positions, amplifying downward pressure.
Neutral or Sideways Scenario
A third possibility is that Ethereum consolidates between $1,810 and $2,200, with neither bulls nor bears establishing a decisive advantage. This sideways action might persist until a major catalyst—such as a significant macroeconomic development, a Bitcoin rally, or an Ethereum network upgrade—triggers a breakout in one direction or the other.
Indicators to Watch for a Rebound to the Highs
As mentioned earlier, volume is critical in confirming breakouts. If Ethereum sees a surge in trading volume on days it moves upward, it suggests genuine market conviction. Monitoring daily volume relative to the 50-day or 100-day moving average of volume can help identify whether interest is picking up.
On-Chain Growth and Whales Accumulation
Another bullish indicator would be an increase in large transactions or whale addresses adding to their holdings. If on-chain data shows whales accumulating ETH rather than distributing it, it could signal that “smart money” anticipates further upside.
Additionally, keep an eye on daily active addresses and transaction counts. A rising number of users interacting with the Ethereum network could correlate with growing demand for ETH, potentially supporting higher prices.
Positive Macro or Industry News
External factors can also drive Ethereum’s price. News of regulatory clarity, institutional adoption, or major partnerships can shift sentiment from cautious to optimistic. For example, announcements related to Ethereum’s transition to Proof-of-Stake, Layer-2 solutions, or improvements in transaction fees can boost confidence in ETH’s long-term prospects.
RSI and MACD Divergences
Technical indicators like the Relative Strength Index (RSI) and the Moving Average Convergence Divergence (MACD) can offer clues about trend changes. A bullish divergence occurs when price makes a lower low while the indicator makes a higher low, suggesting selling pressure is weakening. Spotting such divergences can provide early warning that a meaningful reversal is underway.
Final Words
Ethereum’s latest surge to $2,036 has once again sparked debate over whether this move marks the beginning of a genuine trend reversal or if it is merely another bull trap in a market that has repeatedly dashed traders’ hopes. The critical $1,810 support level has held so far, but ETH remains below key overhead resistance in the $2,200–$2,300 zone. A convincing break above that resistance, supported by strong trading volume, would go a long way toward dispelling fears of another failed rally.
On-chain metrics reveal that whales still control about 45.50% of Ethereum’s supply, meaning that large investors can heavily influence price action. The majority of addresses hold relatively small amounts of ETH, reflecting widespread retail interest in the network. A significant portion (over 70%) are long-term holders, which could provide stability—unless negative sentiment grows so strong that even patient investors decide to exit.
Whether Ethereum can climb back toward $2,500, $2,800, or beyond will depend on a confluence of factors: robust volume on upswings, whale accumulation, macroeconomic tailwinds, and potential network developments. Conversely, if ETH’s price stalls below $2,200–$2,300 and selling pressure resurfaces, another trip down to $1,810—or lower—could be in the cards. In such a scenario, the risk of another bull trap remains high.
Disclaimer: The opinions expressed in this article are those of the author and are not intended as financial advice. Always do your own research before making any investment decisions.