MOG Coin has been on a steep downtrend since reaching $0.0000039 in December. It now trades at $0.0000003978, a new all-time low. The price drop has triggered questions about whether MOG will bounce or continue to slide. In this post, we will examine the technical indicators, discuss the next possible support level, and explore the role of whale holdings. We will also look at addresses by holdings, addresses by time held, and what these metrics might mean for the coin’s future price action.
Current Market Snapshot
Price and Volume
MOG Coin is trading at $0.0000003978, marking an 11.36% decline in the last 24 hours. Its 24-hour trading volume stands at $17,414,932, giving it a Vol/Mkt Cap ratio of about 11.28%. This level of trading volume suggests active market participation, though recent sellers appear to dominate.
Market Capitalization and Supply
The market cap is $154,310,754, placing MOG at #239 on CoinMarketCap. The total supply is 390.56 trillion MOG, while the max. supply is 420.69 trillion. The high supply can influence price behavior, especially if more tokens enter circulation.
Recent Price Action
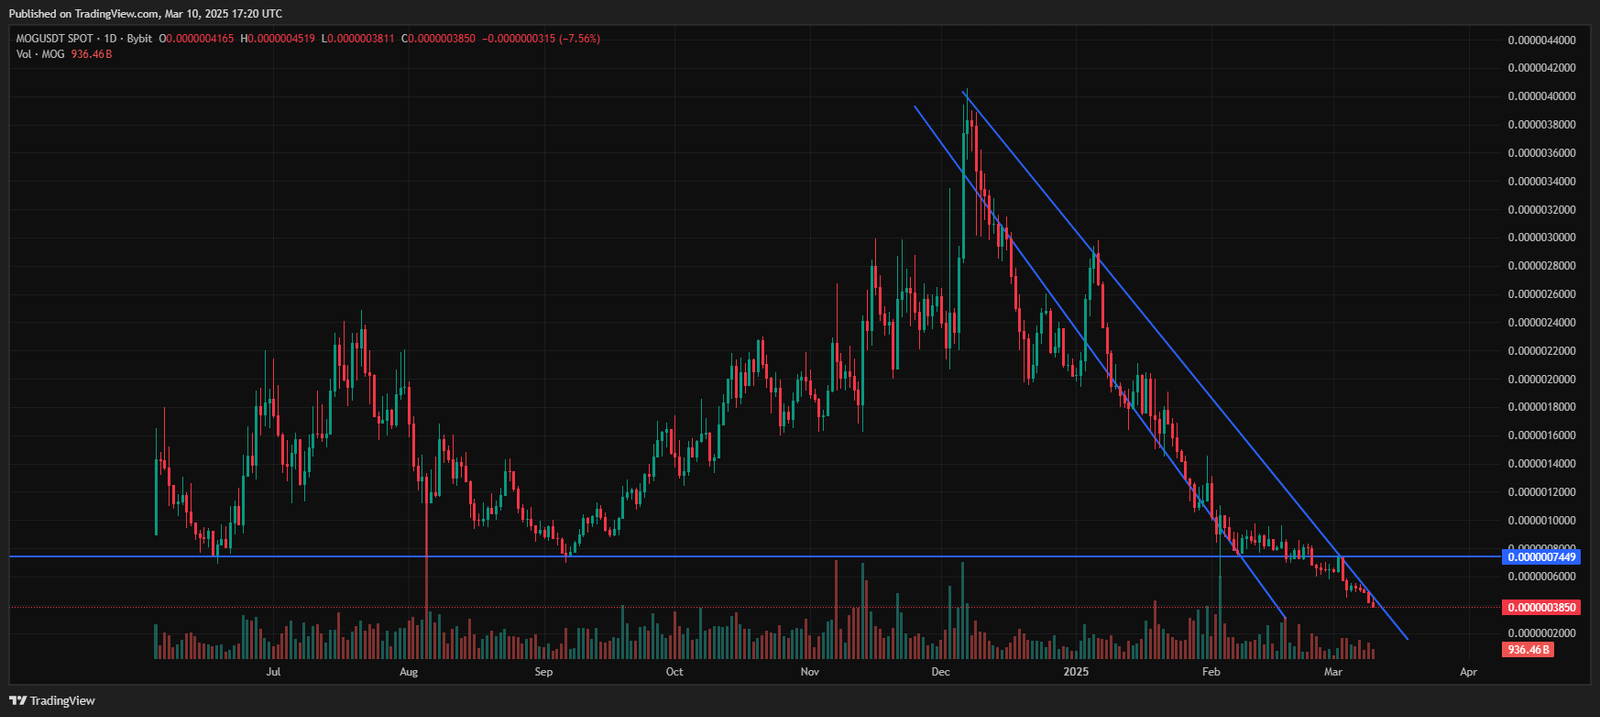
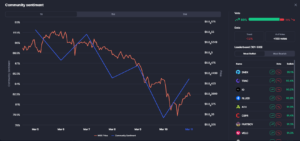
MOG’s descent from $0.0000039 in December to its current price near $0.0000003978 reflects a persistent downward trend. The chart shows lower highs and lower lows, suggesting that selling pressure remains strong. Attempts at bouncing have been short-lived, as the coin continues to set new lows.
Technical Analysis
Descending Channel
A descending channel is visible on the chart. This pattern indicates that each rebound faces a strong ceiling, and each dip finds a lower floor. Until the price breaks above the upper boundary of this channel, the downtrend is likely to persist.
Next Support Level
The current all-time low of $0.0000003978 does not have a historical floor below it. Traders often look for psychological round numbers or fib-based extensions for the next potential support. Based on the chart structure, $0.0000003500 could be a short-term target if selling pressure continues. If that level breaks, some analysts predict a move closer to $0.0000003000 or lower, given the absence of prior support zones.
Possible Bounce Triggers
A meaningful bounce would require a volume spike and evidence of buyer interest. If MOG can reclaim the $0.0000004500 region with strong trading volume, it may spark a short-term relief rally. However, failing to breach that level would confirm the downtrend’s strength, making further declines more likely.
On-Chain Metrics and Their Impact
Whale Holdings
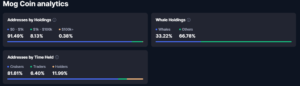
Whales control 33.22% of the circulating supply. This means a handful of large holders can influence the market. If whales decide to buy more, the price could stabilize or rally. If they sell, it may trigger panic among smaller holders. Tracking whale movements can offer clues about major price swings.
Addresses by Holdings
- $0–$1k: 91.49%
- $1k–$100k: 8.13%
- $100k+: 0.38%
These figures show that most MOG holders have small balances, suggesting a retail-driven market. Large accounts above $100k are few, but they hold a significant portion of the supply. A sudden move from these large addresses can magnify price volatility.
Addresses by Time Held
- Cruisers (81.61%): These addresses hold MOG for moderate time spans, often waiting for a favorable market.
- Traders (6.40%): These addresses frequently buy and sell, contributing to short-term volatility.
- Holders (11.99%): These addresses keep MOG long-term, showing faith in the project’s future.
A high percentage of cruisers means many holders are neither quick flippers nor long-term investors. If the price keeps falling, cruisers may exit, adding to downward pressure. Conversely, if MOG shows signs of life, they might become a strong buying force, fueling a rebound.
Case for the Bears
Persistent Downtrend
The price has formed a clear downtrend with no major support below $0.0000003978. Sellers remain dominant, and each failed bounce reinforces the bearish momentum.
Lack of Historical Support
Since MOG is at new lows, there are no established support zones to cushion further drops. This vacuum can accelerate price declines if market sentiment worsens.
Whales Could Sell
Whales holding over 33% of the supply could decide to reduce their positions. A large sell-off from these addresses might trigger a chain reaction of retail panic.
Case for the Bulls
The coin may be oversold on certain technical indicators like RSI or MACD. An oversold market can stage a relief rally, especially if volume surges at a key level.
Potential Whale Accumulation
If the big holders see value at these lows, they could accumulate more tokens. This buying activity would reduce supply on the market, potentially sparking a price rebound.
Retail Turnaround
Retail investors, who make up the majority of holders, could buy more if they believe the project has strong fundamentals or if social media hype picks up. A surge in positive sentiment can reverse a downtrend.
Final Words
MOG’s steep decline from $0.0000039 in December to $0.0000003978 today reflects a harsh bear trend. The chart points to further downside unless a strong catalyst emerges. Key on-chain metrics highlight that whales own a large portion of the supply, and many addresses hold modest amounts of MOG. This setup can create swift price moves if whales or retail traders decide to act in unison.
A bounce is possible, but it depends on volume, whale behavior, and a break above the descending channel. The next support zone sits around $0.0000003500, with a deeper floor near $0.0000003000 if selling persists. Bulls must push the price above $0.0000004500 for a credible reversal. Until then, the bears appear to have the upper hand.
If you plan to trade MOG, keep a close eye on the whales and watch for shifts in trading volume. Pay attention to any major news or community developments. In a market dominated by sentiment, a sudden surge in optimism can spark a rapid turnaround. For now, caution remains warranted as MOG continues its downward slide, searching for a stable floor.
Disclaimer: This article is for informational purposes only and should not be considered financial or investment advice. Always conduct thorough research and consult with financial professionals before making investment decisions.