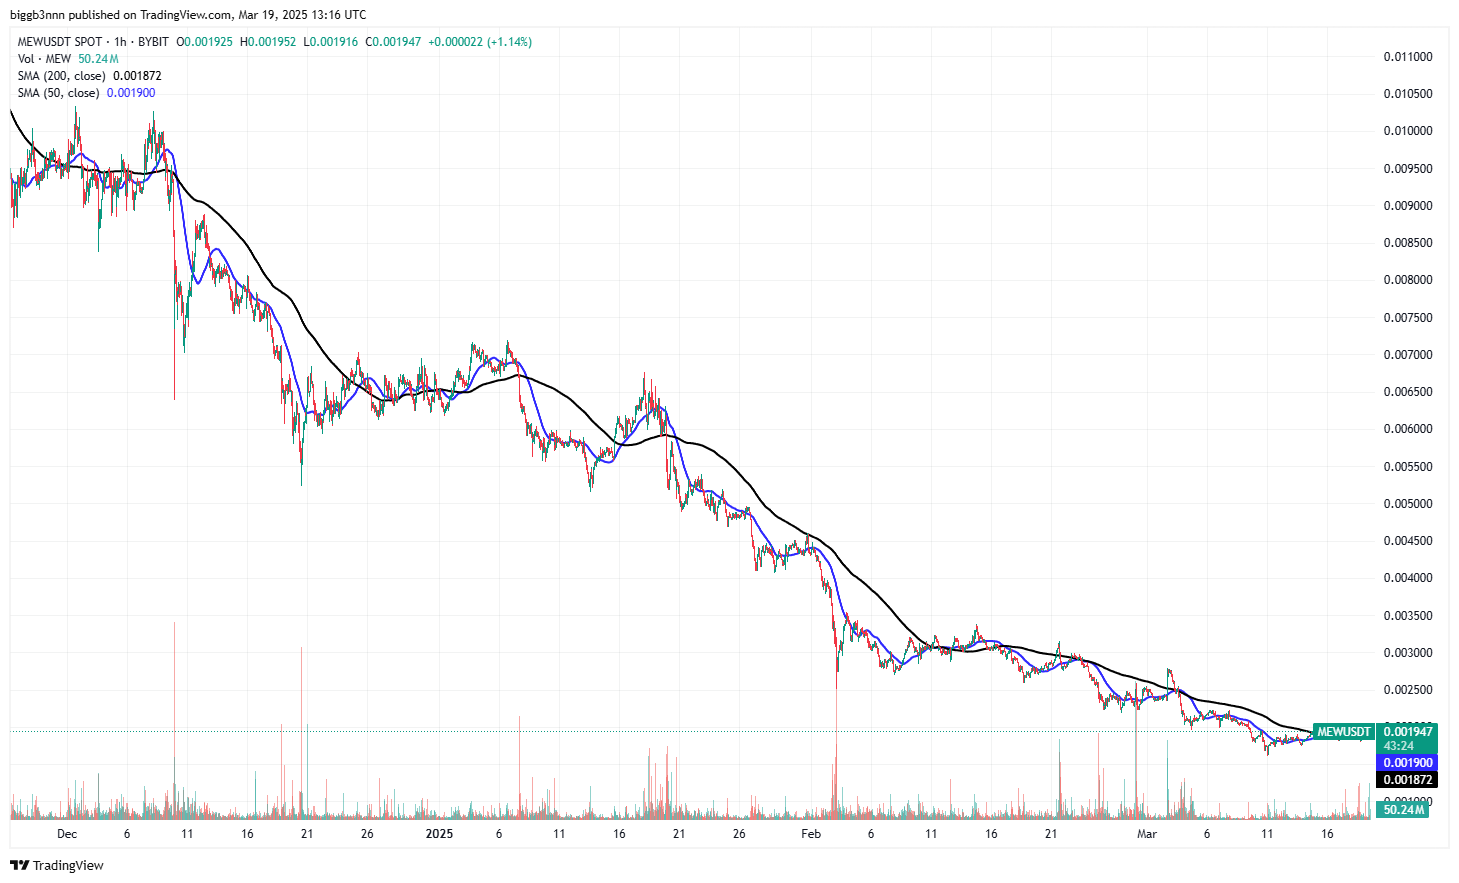
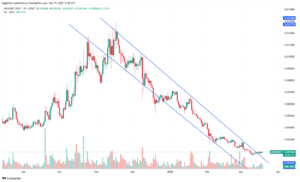
The meme coin frenzy has birthed yet another contender in the space, and Cat In Dogs World ($MEW) is making waves—albeit on a downward trajectory. Since hitting a high of $0.012, $MEW has been caught in a descending channel, currently trading at $0.001928. The question now is: where is it heading next? Let’s dive deep into the technical analysis of $MEW and examine the possible outcomes.
Current Market Overview
As of now, Cat In Dogs World ($MEW) is priced at $0.001928, showing a slight 3.17% increase in the last 24 hours. Despite this small recovery, $MEW has experienced a prolonged downtrend, dropping significantly from its peak of $0.012. The decline has been consistent, forming a descending channel, a technical pattern that often signals continued bearish pressure unless a breakout occurs.
Volume and Market Capitalization
One crucial indicator to watch is the 24-hour trading volume, which currently stands at $20,324,317. This is a significant drop compared to previous levels, indicating diminishing interest from traders. A decline in volume usually suggests that fewer participants are willing to buy at current levels, reducing the likelihood of an immediate reversal.
$MEW holds a market capitalization of $171,398,808, ranking it #236 on CoinMarketCap. The fully diluted valuation remains at the max supply of 88,888,888,888 MEW coins, meaning there is no inflationary pressure from additional token issuance.
Technical Indicators and Key Levels
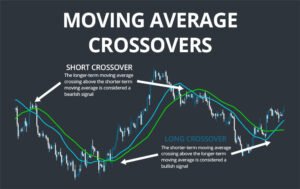
Moving Averages: A Crucial Crossover
One of the most notable developments in $MEW’s hourly chart is the moving average crossover between the 50 SMA (Simple Moving Average) and the 200 SMA. This crossover is often regarded as a golden cross when occurring in an uptrend, or a death cross when occurring in a downtrend.
Currently, $MEW has climbed above both the 50 and 200-day SMAs, which is a bullish signal suggesting that a potential trend reversal might be underway. However, confirmation is needed, particularly through higher trading volumes and sustained price action above key resistance levels.
Support and Resistance Levels
- Immediate Support: $0.0018 (short-term support based on recent lows)
- Stronger Support Zone: $0.0015 (historical demand zone)
- Immediate Resistance: $0.0020 (psychological resistance and previous support-turned-resistance)
- Key Resistance Levels: $0.0025 and $0.0030 (breakout confirmation levels)
A break below $0.0018 could accelerate selling pressure, leading to a retest of $0.0015. However, if buyers step in and volume increases, a push toward $0.0025-$0.0030 is possible.
What Does the Volume Decrease Mean?
Volume is a leading indicator in technical analysis, often signaling potential shifts in trend strength. In the case of $MEW:
- Decreasing Volume in a Downtrend: Indicates that sellers are losing momentum. If the price stabilizes at key support levels, a potential reversal could occur.
- Increasing Volume with Price Recovery: Would confirm the breakout and strengthen the bullish case.
- Low Volume on Rallies: Could result in fake breakouts, leading to further declines.
For a meaningful rebound, $MEW needs a surge in volume above $30 million-$40 million in daily trading, confirming buyer confidence.
Indicators of a Possible Rebound to the Highs
1. Breakout from the Descending Channel
A breakout above the upper boundary of the descending channel, ideally with strong volume, would be the first sign of a bullish shift. If $MEW can reclaim $0.0030, it would signal a potential move toward higher resistance levels.
2. Sustained Trading Above the 50 and 200 SMA
Now that $MEW is above both the 50-day and 200-day SMAs, the next test is whether it can hold above them. If it does, this will act as dynamic support and increase the probability of further upside.
3. MACD and RSI Confirmation
- MACD (Moving Average Convergence Divergence): A bullish crossover on the MACD, with the signal line moving above the MACD line, would confirm upward momentum.
- RSI (Relative Strength Index): Currently around 40-45, RSI needs to push above 50-55 to confirm strength in the recovery. If it moves into the 70+ zone, it could signal overbought conditions, requiring caution.
4. Fibonacci Retracement Levels
Applying Fibonacci retracement from the $0.012 high to the $0.0018 low, key levels to watch include:
- 23.6% Retracement: $0.0032 (first target in case of a breakout)
- 38.2% Retracement: $0.0048 (major resistance)
- 50% Retracement: $0.0060 (psychological level)
A breakout above $0.0032 would indicate the start of a recovery phase.
Where Is $MEW Heading Next?
$MEW’s price action suggests that while the overall trend remains bearish, there are early signs of a possible reversal. The recent crossover between the 50 and 200 SMA is a bullish development, but confirmation is needed through increasing volume and sustained price movement above $0.0025-$0.0030.
Key factors to watch in the coming days include:
- Breakout from the descending channel
- Sustained trading above 50 & 200 SMA
- Volume surge above $30M+
MACD and RSI turning bullish
If $MEW manages to hold above current levels and push beyond $0.0025, we could see an attempt to reclaim $0.0032 and beyond. However, if volume continues to decline, a retest of $0.0018 and potentially $0.0015 could be on the horizon.
Traders should exercise caution, keeping an eye on volume spikes and resistance levels before jumping into a bullish bias. While $MEW shows promise, confirmation signals are essential before predicting a return to previous highs.
Is $MEW a Buy?
For short-term traders, a confirmed breakout could present an opportunity. Long-term holders should wait for a clear reversal pattern before considering re-entry. Always use proper risk management, set stop losses, and stay updated on market trends before making investment decisions.
Disclaimer: The opinions expressed in this article are those of the author and are not intended as financial advice. Always do your own research before making any investment decisions.