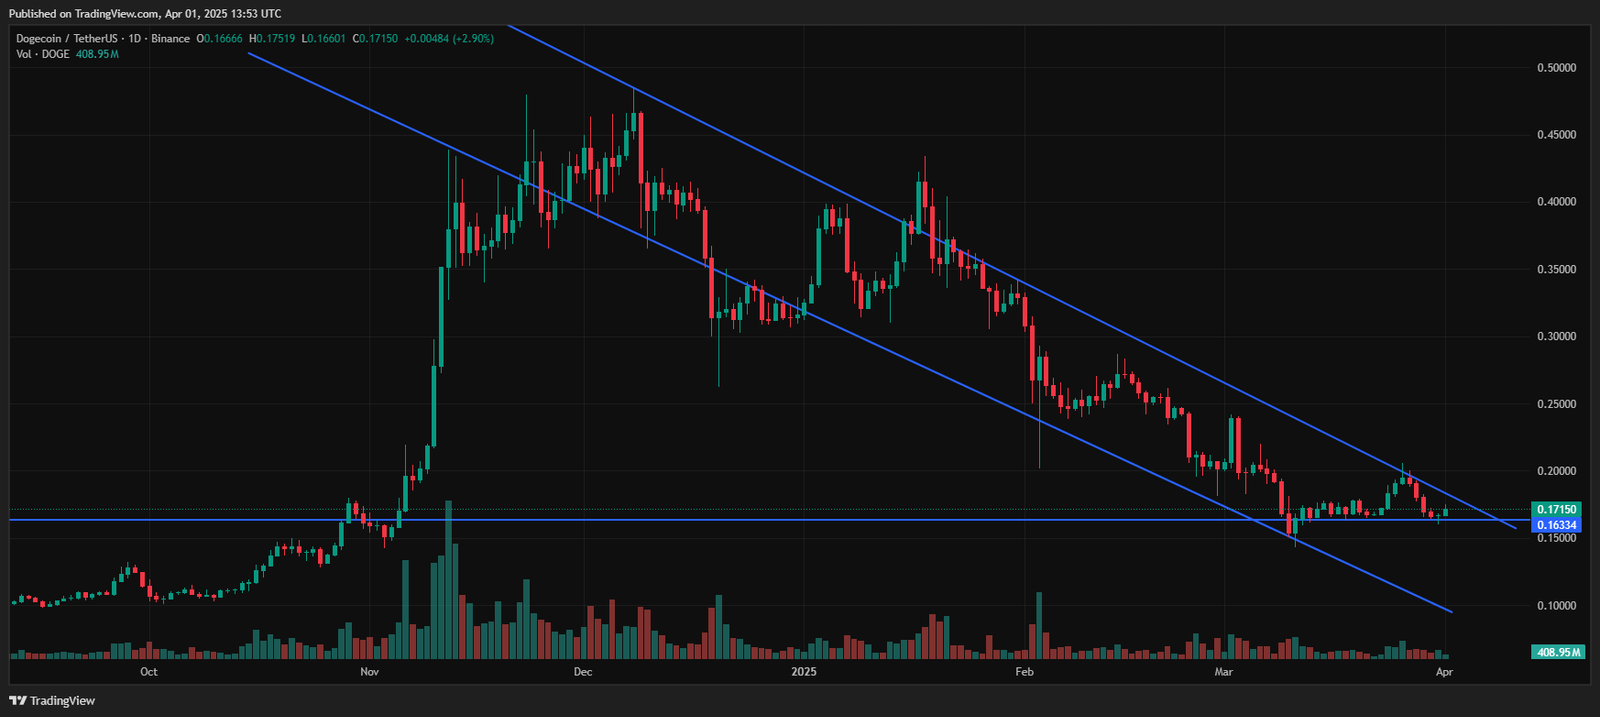
The technical picture for DogeCoin is becoming increasingly compelling as the meme coin tests a critical support zone on its daily chart. With a recent seasonal high of approximately $0.48 in December, Doge has been trending lower and is now consolidating near a key support level at around $0.163.
In this detailed technical analysis, we break down the current market structure, explore potential scenarios if Doge breaks or holds this support, and identify the next critical support and resistance levels that traders should watch.
Current Price Action and Chart Analysis
Doge Coin’s daily chart reveals a well-established descending channel that has been in play since the peak near $0.48 last December.
The descending channel indicates a persistent bearish sentiment in the market, as sellers have managed to push prices lower over time. Recently, the price has been consolidating around the $0.163 area—a crucial support zone that is now acting as a potential turning point.
Recent Downtrend and Seasonal High
At the peak in December, DogeCoin surged to around $0.48, which marked a seasonal high driven by strong market sentiment and retail investor enthusiasm. Since then, however, the price has retraced significantly.
This drop has been accompanied by a descending channel, suggesting that sellers have dominated the market dynamics over the past few months. The current consolidation near $0.163 signals a potential base where buyers might step in, but it also represents a critical battleground between bulls and bears.
The Significance of the $0.163 Support Zone
The $0.163 level is not just a random price point; it’s a significant technical support zone for several reasons:
- Volume Accumulation: Often, support levels coincide with areas where there has been substantial buying interest in the past. This price level may have attracted bargain hunters who view the current discount as an opportunity to accumulate DogeCoin.
- Psychological Barrier: Round numbers or levels close to previous swing lows tend to act as psychological barriers. Traders often remember these levels, which then become self-fulfilling prophecies.
- Technical Confluence: The support level may align with other technical indicators or Fibonacci retracement levels from previous highs, increasing its significance in the eyes of technical analysts.
This convergence of factors makes $0.163 a critical point that could dictate the next leg of Dogecoin’s price action.
Scenario Analysis: What Happens if DogeCoin Breaks the Support?

A break below the $0.163 support level could signal a renewed bearish phase. Let’s explore what might happen if DogeCoin fails to hold this key support.
Potential for Further Downside
Should DogeCoin break below $0.163, the immediate consequence would likely be a shift in market sentiment from cautious consolidation to outright bearishness.
The breakdown would suggest that selling pressure has overwhelmed the buyers’ efforts at the current level. In such a scenario, the descending channel that has characterized the price action would take center stage, and we could expect a cascade of further losses.
Identifying the Next Support Level
If the price breaches the $0.163 level, technical analysts would then focus on identifying the next significant support level. Based on the historical price action and the structure of the descending channel, the following areas are worth watching:
- First Downside Target: Around $0.125
This level could represent the next logical support if the price continues to fall. It likely corresponds to a previous area of consolidation or a minor swing low. A drop to this area would indicate that the market is ready to absorb further selling pressure. - Further Support: In the $0.10 Region
If the bearish momentum remains unabated, DogeCoin could test the $0.10 level. This level may serve as a deep-dive support area, potentially providing a long-term bottom if the broader market sentiment remains negative.
Implications of a Support Breakdown
A confirmed breakdown below $0.163 could lead to several key implications:
- Increased Bearish Sentiment: A breach would likely trigger stop-loss orders and induce panic selling among less experienced traders, further exacerbating the downward move.
- Technical Sell Signals: Many technical indicators, such as moving averages and momentum oscillators, might turn bearish, adding confirmation to the downtrend.
- Potential for a Prolonged Correction: A sustained move below $0.163 could indicate that DogeCoin is in for a prolonged correction phase, which might deter short-term speculative trades until a clear reversal pattern emerges.
Scenario Analysis: What Happens if DogeCoin Holds the Support?
While the downside scenario is concerning, there’s also a possibility that DogeCoin can hold the $0.163 support level. Let’s examine the bullish scenario and what technical levels might be expected if support holds.
Bullish Signal: Support Holding and Buyer Accumulation
If DogeCoin manages to hold the $0.163 support, it could be a sign that buyers are stepping in aggressively at this critical level. A successful defense of this support would imply that the consolidation is merely a pause in the overall trend, potentially setting the stage for a bullish reversal.
Key factors that would support this scenario include:
- Volume Increase on Up Moves: A spike in volume as the price approaches $0.163 from above could indicate that buyers are accumulating the asset at a discount.
- Rejection of Lower Lows: If the price tests $0.163 multiple times and fails to break through, this repeated rejection could confirm the strength of the support level.
- Technical Buy Signals: Indicators like the Relative Strength Index (RSI) might move out of oversold territory, and bullish divergence on oscillators could support the notion of a reversal.

Identifying the Next Resistance Level
Assuming that DogeCoin holds support and buyers gain control, the next step is to identify where the price might head next in terms of resistance. Based on the chart’s historical behavior, the following areas are key:
- First Resistance Target: Around $0.20 to $0.22
In the event of a rebound from the support level, DogeCoin might initially face resistance in the $0.20 to $0.22 range. This area could represent previous swing highs or a retracement of the descending channel’s midline. If the price reaches this zone, expect it to encounter selling pressure from traders looking to take profits. - Secondary Resistance: Near $0.28 to $0.30
If the bullish momentum persists and DogeCoin decisively breaks through the initial resistance, the next significant barrier could be found around $0.28 to $0.30. This level might align with historical highs or key Fibonacci retracement levels from the seasonal high of $0.48, making it a logical target for further price appreciation.
Implications of Holding Support and Rebounding
A firm hold of the $0.163 support would have several positive implications for DogeCoin:
- Reversal of Trend: Sustained buying interest could signal a reversal of the long-term downtrend, potentially leading to a re-establishment of a bullish channel.
- Accumulation Phase: The support level might represent an accumulation phase where savvy investors are buying the dip, setting the stage for a gradual price recovery.
- Enhanced Market Sentiment: A successful bounce from $0.163 could restore confidence among traders and potentially trigger a broader rally across the crypto market, especially if the coin benefits from positive sentiment surrounding its meme status.
Final Words
The current technical landscape for DogeCoin presents a clear bifurcation: a critical battle at the $0.163 support level that will determine the coin’s short- to medium-term trajectory.
A breakdown below this level would likely intensify bearish sentiment and push DogeCoin toward further supports in the $0.125 to $0.10 range, while a successful hold could act as a springboard for a rebound toward resistance levels around $0.20 to $0.22—and possibly further to $0.28 to $0.30.
Traders should closely monitor the volume and momentum indicators as DogeCoin approaches these key technical zones. Whether you are a short-term trader looking to capitalize on market volatility or a long-term investor eyeing accumulation opportunities, the current setup demands caution and strategic planning. In the world of cryptocurrencies, technical levels often dictate market sentiment and price action, and the upcoming tests at $0.163 will be critical in shaping the future of DogeCoin.


