Bitcoin has long been known for its volatility, dramatic bull runs, and steep corrections. Yet, beneath these intense price swings, there are patterns that emerge year after year. These patterns, referred to as “seasonality,” can give traders and investors insight into when Bitcoin is more likely to rise or fall based on historical trends. Seasonality does not guarantee an outcome, but it can help you form better trading strategies and risk management plans by providing a statistical context for what has happened in the past.
Analyzing Bitcoin’s seasonality from 2019 to March 10th, 2025, reveals recurring trends in different quarters of the year, as well as several anomalies that deviate from historical patterns. By understanding when Bitcoin tends to perform well or struggle, you can anticipate shifts in market sentiment and adjust your positions accordingly. In this comprehensive blog post, we will examine Bitcoin’s price behavior from 2019 to the first quarter of 2025, highlight notable seasonal patterns, discuss anomalies that shaped each year, and forecast what these observations may mean for the months ahead.
Analyzing Bitcoin from 2019 to 2025
The 2019 Bitcoin Data
The year 2019 started with Bitcoin hovering around $3,800 in early January. This was a period of relative quiet after the massive bull run and subsequent crash of 2017–2018. During the first quarter of 2019, Bitcoin mostly traded sideways, showing minimal signs of a major breakout. However, by April 2019, a modest rally began, and Bitcoin climbed above $5,000. This increase aligned with a pattern often seen in Q2, where Bitcoin has historically shown some recovery after a slow Q1.
The summer of 2019 brought further upside, pushing Bitcoin close to $13,800 in late June. That jump represented a year-to-date gain of over 250% from its January lows. But the second half of the year introduced more volatility and a series of pullbacks. By December 2019, Bitcoin had retraced to around $7,200, reflecting a partial giveback of the earlier gains. This pattern—rising strongly in the spring and early summer, followed by a more challenging autumn and winter—would become an essential observation in later years.
The 2020 Bitcoin Data
The year 2020 began with Bitcoin trading near $7,200, showing signs of a slow climb into the first few weeks. Then, the global COVID-19 pandemic struck, causing a broad market sell-off in March. Bitcoin plunged to around $3,900 on March 12th, 2020, a day many crypto traders refer to as “Black Thursday.” This event represented one of the most significant anomalies in Bitcoin’s history. Traditional seasonal patterns did not matter during this extreme liquidity crisis, as nearly every asset class faced panic selling.
Following the March crash, Bitcoin staged a remarkable recovery. By the end of Q2 2020, it had reclaimed the $9,000–$10,000 range. One factor behind this rebound was the third Bitcoin halving event on May 11th, 2020, which reduced the block reward from 12.5 BTC to 6.25 BTC. Historically, halvings tend to introduce bullish pressure over the subsequent 12 to 18 months, as the newly minted supply of Bitcoin decreases.
In Q4 2020, Bitcoin skyrocketed, breaking past $20,000 for the first time since the 2017 peak. By December 31st, 2020, it was trading near $29,000, culminating in a near 300% increase from its lows in March. This late-year rally aligned with a seasonal tendency for Bitcoin to gain momentum in Q4, although the pandemic-induced market conditions and halving cycle also played significant roles.
The 2021 Bitcoin Data
Bitcoin entered 2021 at around $29,000. The first quarter saw steady gains, leading to a new all-time high near $64,000 in mid-April. This surge coincided with increased institutional adoption, as companies like Tesla announced significant Bitcoin purchases, and major banks started exploring crypto services. April has historically been a strong month for Bitcoin, and 2021 was no exception.
However, in May 2021, Bitcoin experienced a swift correction, falling below $30,000 by the end of the quarter. This drop represented more than a 50% decline from its April peak. China’s crackdown on cryptocurrency mining and concerns over Bitcoin’s environmental impact contributed to the negative sentiment. Historically, Q2 can be volatile, but the scale of this move was more dramatic than usual.
The remainder of 2021 was marked by volatility. Bitcoin rebounded to a new all-time high near $69,000 in November but finished the year at around $47,000. This performance indicated a somewhat typical pattern: a strong surge in the first half, a mid-year correction, and another rally into the late autumn months. Despite the year-end price being below its peak, 2021 still illustrated that the halving effect from 2020 was in play, driving a net bullish trend overall.
The 2022 Bitcoin Data
Bitcoin started 2022 trading around $47,000. The first quarter showed weakness as the broader market contended with shifting macroeconomic conditions, including rising interest rates and fears of inflation. By the end of Q1, Bitcoin hovered near $45,000. Then, as Q2 unfolded, the market witnessed a sharp decline, pushing Bitcoin below $30,000 once again. This downturn was exacerbated by the collapse of certain large crypto ventures, adding to the bearish sentiment.
During the summer of 2022, Bitcoin briefly stabilized in the $20,000–$25,000 range, but it remained under pressure. By late November, it reached a cycle low near $15,500, largely due to a combination of negative market sentiment, high-profile bankruptcies in the crypto space, and tightening monetary policies around the globe. This was an atypical Q4 slump, differing from the seasonal trend of year-end rallies seen in prior bullish cycles. The result was that 2022 ended on a distinctly bearish note, underscoring that seasonality can be overshadowed by external factors like liquidity crises and macroeconomic headwinds.
The 2023 Bitcoin Data
Bitcoin entered 2023 at approximately $16,500, reflecting the depressed conditions of the previous year. The first quarter surprised many traders, as Bitcoin mounted a sharp rally back to $25,000 by mid-February. This move suggested a short squeeze and renewed investor confidence, partly fueled by the Federal Reserve’s signals that it might slow its rate hikes. Seasonally, Q1 has been mixed over the years, but the rebound in early 2023 aligned well with the concept of a “January effect,” where fresh capital often enters markets after the new year.
By mid-2023, Bitcoin tested $30,000 multiple times, but macro uncertainty and regulatory scrutiny in several major economies limited its upside potential. While Q2 often sees moderate gains, the second quarter of 2023 was a roller coaster, swinging between $28,000 and $31,500. The second half of the year saw a modest rally to $35,000 before a year-end consolidation phase near $32,000. Overall, 2023 turned out to be a transitional year, shifting from a bear market environment to a more neutral stance.
The 2024 Bitcoin Data
The year 2024 kicked off around $32,000 and quickly accelerated. By March, Bitcoin touched $42,000, supported by improving global economic conditions and anticipation of the fourth Bitcoin halving scheduled for April 2024. Historically, the months leading up to a halving often see heightened speculation and price appreciation, and 2024 was no exception.
Once the halving occurred, Bitcoin’s block reward dropped from 6.25 BTC to 3.125 BTC. Over the next few months, Bitcoin soared past $50,000 and even tested $60,000 by late summer. This rally echoed the post-halving run of 2020–2021, though it did face intermittent pullbacks tied to regulatory news in different regions. By December 2024, Bitcoin reached a new peak of $75,000, a significant milestone that confirmed the bullish narrative surrounding halving events. The end-of-year price settled near $72,000, reflecting a strong uptrend that aligned with seasonal tendencies for Q4 rallies, especially in a halving year.
The Early 2025 Bitcoin Data
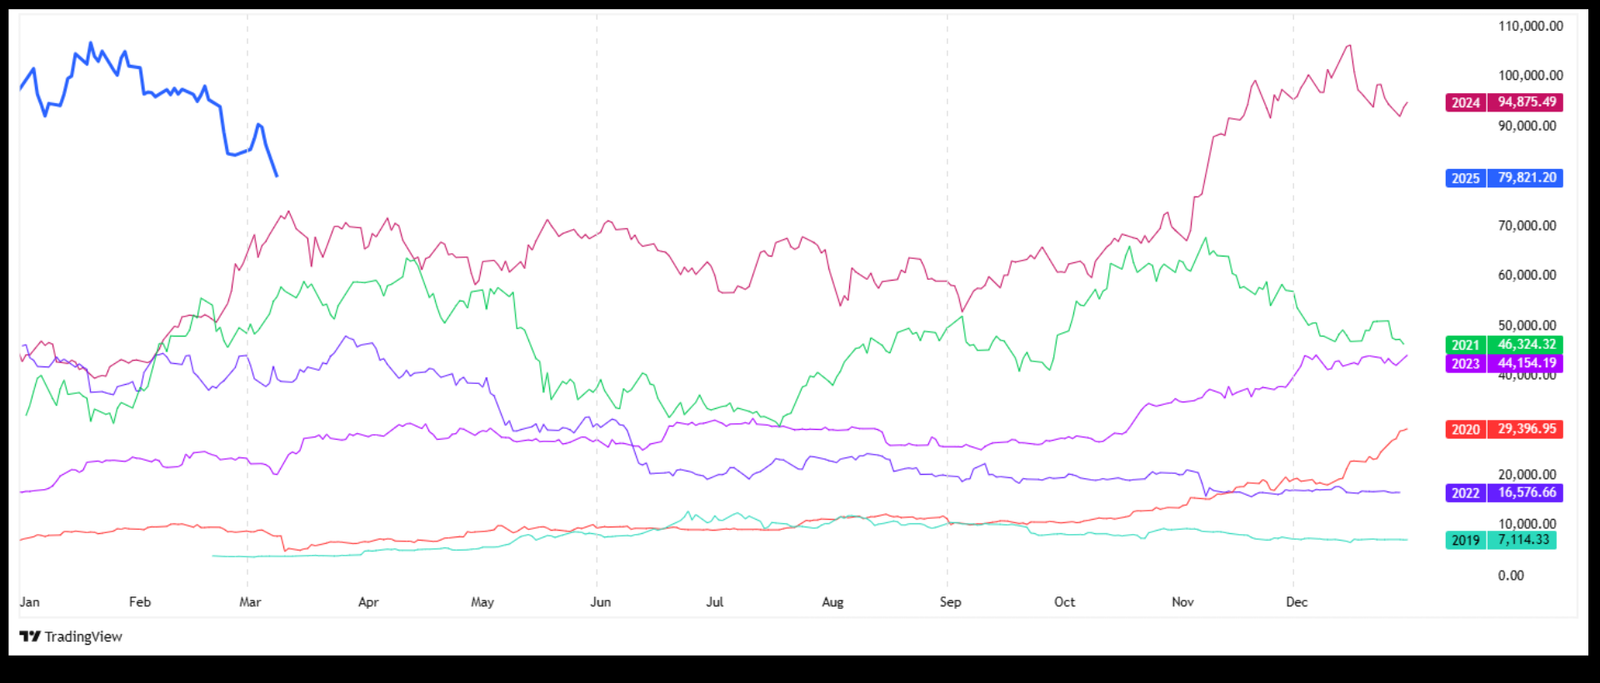
Bitcoin entered 2025 with momentum, trading near $72,000 in January. The first two months saw a push to $85,000, driven by continued optimism around institutional adoption and a spike in retail participation. However, by March 10th, 2025, Bitcoin had retraced slightly to $78,300, suggesting that some profit-taking had occurred.
Seasonally, Q1 can be a mixed bag, but the historical data from previous halving cycles indicates that the year following a halving can still produce significant upside. The fact that Bitcoin remains well above $70,000 this early in the year hints that a strong bull market may persist, though corrections and consolidations should be expected.
Key Seasonal Patterns
Q1 Observations
From 2019 through 2025, Q1 has often displayed choppy behavior, except during pronounced bull markets or after major events like the 2020 pandemic crash. In some years, such as 2023, Q1 saw a surprising rally from $16,500 to $25,000. In other years, like 2019, Q1 was mostly sideways until the market gained momentum in April. This inconsistency means Q1 can either set the tone for a year-long rally or remain stuck in a range until a catalyst appears.
Q2 Observations
Historically, Q2 has been one of the more bullish quarters for Bitcoin. In 2019, we saw a significant run from $5,000 to nearly $13,800 in late June. In 2020, Q2 encompassed the recovery from the COVID-19 crash and the May halving. Even in 2021, despite the major drop in May, the quarter started strongly with Bitcoin near $64,000. By contrast, Q2 in 2022 was more bearish, underscoring how broader macro conditions can override seasonal tendencies.
Q3 Observations
Q3 has a reputation for being mixed. Some years, like 2021, saw a recovery from the May–July correction, rallying into August. Other years, such as 2022, continued a downtrend that started in Q2. Q3 can often be overshadowed by summer doldrums or overshadowed by major events, like the anticipation of a halving. If no halving or large-scale news is on the horizon, Q3 can become a consolidation phase.
Q4 Observations
Q4 is famous for delivering strong price moves, whether bullish or bearish. In 2020, Bitcoin surged from $13,000 to $29,000 in Q4. In 2021, it reached $69,000 in November before retreating to $47,000 by year’s end. Q4 in 2022 defied the typical bullish narrative and continued a downtrend, falling to near $15,500 in November. In 2024, Q4 brought Bitcoin to a new peak of $75,000, reaffirming the tendency for halving-year Q4s to be especially bullish.
Anomalies and External Factors
The 2020 Pandemic Crash
One of the most striking anomalies was the COVID-19 crash in March 2020. Seasonality was rendered irrelevant as panic gripped global markets. Bitcoin dropped from about $8,000 to $3,900 in a matter of days. While Bitcoin recovered quickly, the event underscored that black swan incidents can overshadow any historical seasonal pattern.
The 2021 Institutional Adoption
In 2021, major institutional players entered the Bitcoin market. Companies like Tesla and MicroStrategy added Bitcoin to their balance sheets, and large asset managers started offering crypto products. This adoption contributed to Bitcoin’s surge to $64,000 in April 2021 and $69,000 in November 2021, surpassing many seasonal expectations. Institutional involvement can magnify price moves beyond what historical patterns would suggest.
The 2023 Regulatory Pressures
During 2023, regulatory pressures in the United States and Europe introduced volatility. Several proposals targeted crypto exchanges and stablecoins, sparking fear that large portions of the crypto ecosystem might face restrictions. While Bitcoin managed to climb from $16,500 to $35,000 during the year, regulatory announcements often caused short-term corrections that disrupted the usual seasonal flows.
The 2024 Halving Impact
The 2024 halving, which reduced the block reward from 6.25 BTC to 3.125 BTC, arrived in April. Leading up to this event, Bitcoin rallied from $32,000 to $50,000. After the halving, it surged past $60,000 and eventually reached $75,000 by December 2024. This trajectory was more aggressive than typical Q2 or Q4 seasonality alone would predict, showcasing the power of halving cycles in shaping Bitcoin’s price narrative.
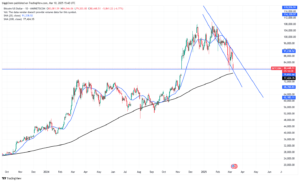
Where We Are Now
As of March 10th, 2025, Bitcoin trades near $78,300, having peaked at $85,000 earlier in the year. Despite a minor correction, the coin remains in a bullish posture, well above the $70,000 mark that provided support in January. This level now serves as a psychological floor that buyers have defended.
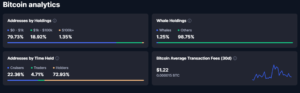
On-Chain Data
On-chain metrics suggest healthy network activity. Daily transaction counts have been rising steadily since late 2024, and active addresses are near all-time highs. Miner revenue has also increased, reflecting a stable mining environment despite the halving’s reduced block reward. Exchange inflows remain moderate, indicating that large holders are not rushing to liquidate.
Market Sentiment
Market sentiment leans bullish. While some investors anticipate a deeper correction due to the steep rally in late 2024, the overall consensus is that Bitcoin’s supply-demand dynamics remain in favor of continued upside. Institutional interest has not waned, with more asset managers exploring Bitcoin-based funds. Retail traders, influenced by social media buzz, are also contributing to the heightened volume.
Forecast for the Next Season
Bullish Scenario
In a bullish scenario, Bitcoin could break above $85,000 once more and set its sights on $90,000 or higher. This scenario might unfold if macroeconomic conditions remain supportive, such as central banks easing monetary policy or renewed excitement about crypto technologies. The halving cycle’s aftereffects could continue to drive scarcity narratives, pushing Bitcoin’s price further. If Bitcoin follows the pattern seen after previous halvings, the mid-year to Q4 window could see accelerated gains, potentially testing the $100,000 mark by the end of 2025.
Bearish Scenario
A bearish turn might occur if global economic conditions deteriorate or if regulators enact stringent measures against cryptocurrency. A break below the $70,000 support could trigger panic selling, leading to a swift move toward the $60,000 range or even lower. Negative sentiment, exacerbated by large sell-offs from institutional players or whales, could override any seasonal tendencies. Historically, Q2 can still be strong, but if external pressures mount, the seasonal rally may fail to materialize, setting the stage for a deeper correction.
Consolidation Scenario
The final possibility is a prolonged consolidation, where Bitcoin hovers between $70,000 and $85,000 for several months. In this case, seasonal patterns might only manifest as minor oscillations within that range, with no decisive break in either direction. Such a scenario could occur if investors wait for clarity on regulatory frameworks, macroeconomic shifts, or the next wave of adoption. A range-bound market can last longer than many traders expect, but it often sets up a significant move once new information or catalysts emerge.
Final Words
Bitcoin seasonality offers a fascinating lens through which to view price action, but it is far from a foolproof roadmap. From 2019 to March 10th, 2025, we have witnessed how recurring seasonal trends—like spring rallies, summer lulls, and year-end surges—can play out. We have also seen how powerful anomalies, such as the 2020 pandemic crash and the 2024 halving, can reshape Bitcoin’s trajectory, either amplifying or negating typical seasonal patterns.
Today, Bitcoin sits near $78,300, riding a wave of bullish sentiment that has persisted since late 2024. This position suggests that the market still favors the upside, even though short-term corrections are possible. If the historical pattern of post-halving bull runs holds, Bitcoin could continue its ascent, potentially testing $90,000 or higher later in the year. On the other hand, macroeconomic headwinds or regulatory changes could spark a reversal, reminding traders that seasonality is only one piece of the puzzle.
For anyone navigating this market, the key is to combine seasonal insights with on-chain data, fundamental developments, and robust risk management. Pay attention to quarter-by-quarter tendencies, but do not ignore external factors like policy changes, adoption rates, and global economic trends. By staying informed and adaptable, you can leverage the lessons of Bitcoin’s seasonality to make more educated decisions in this ever-evolving cryptocurrency landscape.