FARTCOIN, a meme-inspired cryptocurrency, has been on a relentless downward spiral since reaching an all-time high of $2.80 in mid-January 2025. The coin currently trades around $0.30, reflecting a dramatic loss of nearly 90% from its peak. While the crypto space is no stranger to volatility—especially for meme coins—FARTCOIN’s precipitous drop has left many traders and holders questioning whether a reversal is imminent or if the coin will continue to plummet.
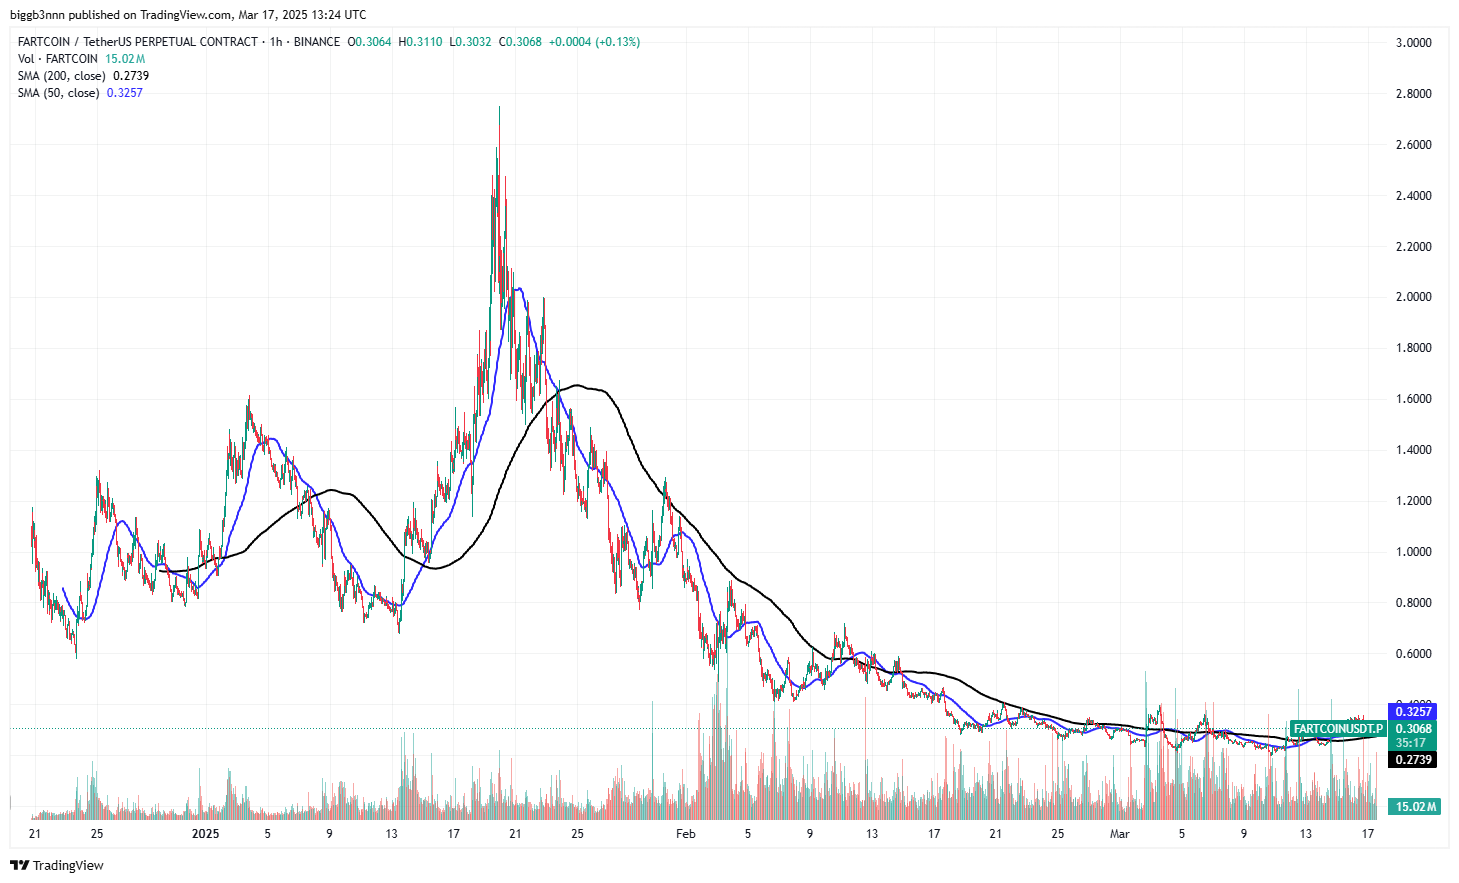
Technical data shows that FARTCOIN is struggling below its 5-day Simple Moving Average (SMA) of $0.32 and remains above the 200-day SMA of $0.274, though not by much. Meanwhile, volume data reveals that selling pressure remains robust, with downward volume surpassing the levels seen during FARTCOIN’s historic run-up to $2.80. This phenomenon raises important questions: Has the coin hit rock bottom, or is there further downside to come? Is a bounce back to previous highs even possible in the near term?
A Quick Overview of FARTCOIN’s Price Action
FARTCOIN’s journey from its all-time high of $2.80 to its current price of $0.30 has been swift and unforgiving. The coin’s initial rally was fueled by a combination of social media hype, retail interest, and broader market optimism. Many meme coins, including FARTCOIN, benefited from the same speculative frenzy that propelled other novelty tokens to record valuations. However, as market conditions changed and profit-taking began, FARTCOIN found itself on a slippery slope downward.
Percentage Drop
The decline from $2.80 to $0.30 represents an approximate 89% drop in value. For perspective, losing nearly nine-tenths of its peak valuation underscores the volatility inherent in meme coins. Such a steep decline has prompted debates about whether FARTCOIN’s hype-driven run is conclusively over or if this is just another cyclical dip.
Shifting Sentiment
During the ascent, social media channels were abuzz with memes and endorsements, with many speculating on FARTCOIN’s potential to hit $5.00 or even higher. Now, the narrative has shifted to fear and uncertainty, as many holders grapple with losses and new investors remain cautious. Understanding whether the coin can recover at least a portion of its former glory requires examining its technical indicators and overall market sentiment.
Technical Analysis: Price, Averages, and Volume
FARTCOIN’s daily chart reveals a clear downtrend. The coin has been printing lower highs and lower lows since its peak, indicating a consistent pattern of selling pressure. Each attempt at a relief rally has been met with renewed selling, driving the price to new local lows.
- Current Price: $0.30
- Recent Low: Just below $0.30 (intra-day swings may vary).
- All-Time High: $2.80 in mid-January 2025.
The chart structure suggests a lack of sustained bullish momentum. While short-term bounces can and do occur, they have so far failed to break the overarching downtrend. As a result, the coin remains vulnerable to further downside unless a strong catalyst emerges.
Moving Averages: 50-Day vs. 200-Day
Moving averages are among the most commonly used tools in technical analysis, providing insights into both short-term and long-term trends.
50-Day SMA at $0.32
The 50-day SMA offers a glimpse into FARTCOIN’s immediate price momentum. At $0.32, this short-term average sits slightly above the current price of $0.30, indicating that FARTCOIN is under short-term selling pressure. Typically, trading above the 50-day SMA suggests near-term bullish momentum, while trading below it signals potential weakness.
- Interpretation:
Because FARTCOIN is below its 50-day SMA, the market is in a short-term downtrend. Bulls looking for a quick trade might wait for the price to break above this moving average before entering a position.
200-Day SMA at $0.274
The 200-day SMA is a widely followed indicator for long-term trends. FARTCOIN’s 200-day SMA at $0.274 sits below the current price of $0.30, meaning the coin has not yet breached this longer-term threshold. In more stable markets, a price above the 200-day SMA is often considered a sign of a bullish long-term trend. However, meme coins can be extremely volatile, so traders should interpret this with caution.
- Interpretation:
If FARTCOIN falls below the 200-day SMA, it could accelerate the downward momentum. Conversely, maintaining a price above this line might offer a glimmer of hope for a medium-term recovery, but only if accompanied by other bullish signals.
Volume Analysis: Higher Downward Volume
Perhaps the most striking aspect of FARTCOIN’s recent price action is the high volume accompanying the downward trend. In many cases, a price decline is associated with decreasing volume, suggesting that fewer participants are interested in selling at lower prices. Here, however, the opposite is true: volume has remained robust, and in fact, it has often been higher on down days than it was during the coin’s rally to $2.80.
What Does High Downward Volume Mean?
- Strong Selling Pressure: High volume during a sell-off usually indicates that sellers are active and willing to offload their positions at increasingly lower prices.
- Institutional or Whale Activity: If larger investors or “whales” decide to exit or reduce their holdings, volume can spike. Meme coins are particularly susceptible to large movements by big holders, given their often concentrated ownership.
- Lack of Buying Support: Even if buyers are present, they may not be strong enough to absorb the large sell orders, resulting in a net downward movement.
This persistent selling pressure is a major red flag. If it continues, the path of least resistance may be further downside. For FARTCOIN to stabilize or bounce, the market would need a notable shift in sentiment, leading to volume-driven buying rather than volume-driven selling.
Where Is FARTCOIN Heading Next?
Support levels are price zones where buying interest tends to overcome selling pressure, at least temporarily. When a coin is in freefall, traders often look to historical price data, psychological round numbers, or key Fibonacci retracement levels for guidance.
- Potential Support Near $0.25: Based on historical price data (particularly from FARTCOIN’s early trading days), $0.25 appears to be a level where the coin previously paused during its ascent. It could act as the next major support if the price continues to decline.
- Psychological Support at $0.20: If $0.25 fails to hold, $0.20 is another round number that might attract buyer interest, at least in the short term.
Should the coin break below $0.25 with conviction—especially on high volume—FARTCOIN might see a rapid drop toward $0.20 or even lower. Meme coins can be subject to dramatic price swings, so traders must remain vigilant and use stop-loss orders to protect against severe losses.
Possible Scenarios
- Continued Downtrend: The most straightforward scenario is that FARTCOIN continues to drift lower, propelled by strong selling volume. If the coin fails to find support at $0.25, the next stop might be $0.20 or even below.
- Short-Term Bounce: Even in a downtrend, short-term relief rallies can occur. A bounce might push FARTCOIN above the 5-day SMA at $0.32, offering traders a brief opportunity to capitalize on a price recovery. However, unless the coin breaks above more significant resistance levels, such as $0.40 or $0.50, the broader downtrend may remain intact.
- Consolidation: Another possibility is that FARTCOIN finds a temporary floor, perhaps around $0.25, and begins to trade sideways. Consolidation could allow the market to “reset” and gauge the coin’s fair value. If volume declines during consolidation, it might signal that sellers have exhausted themselves—setting the stage for a potential reversal.
Indicators of a Possible Rebound
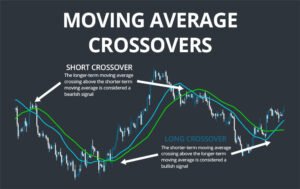
Moving Average Crossovers
One bullish indicator to watch is a potential “golden cross,” where a short-term moving average (e.g., the 5-day SMA) crosses above a long-term moving average (e.g., the 200-day SMA). However, given FARTCOIN’s current structure, a golden cross appears unlikely in the immediate future unless there is a dramatic surge in price. For now, the short-term average is well below the long-term average, reflecting a strong bearish bias.
RSI and MACD Divergences
Two popular momentum indicators that can signal a rebound are the Relative Strength Index (RSI) and the Moving Average Convergence Divergence (MACD). Traders often look for bullish divergences—situations where the indicator forms higher lows while the price forms lower lows.
- RSI Divergence: If the RSI starts trending upward from oversold conditions, even as FARTCOIN sets new price lows, it might suggest weakening selling pressure.
- MACD Bullish Crossover: A MACD line crossing above its signal line in oversold territory can indicate that buyers are re-entering the market. Combined with increasing volume on up days, this could spark a short-term or even medium-term reversal.
Volume Shift from Selling to Buying
Given the high downward volume, a clear sign of a potential rebound would be a shift in volume from selling to buying. Specifically, look for “green volume bars” (on many charting platforms) that exceed recent “red volume bars.” This indicates that buyers are stepping in more aggressively than sellers. If FARTCOIN sees a sudden spike in buying volume near a key support level, it might trigger a short-covering rally or attract momentum traders seeking a bounce play.
Sentiment and News Catalysts
Meme coins like FARTCOIN are especially sensitive to news, social media hype, and community sentiment. A positive announcement—be it a new exchange listing, an endorsement from a celebrity, or a major community event—can quickly reverse negative sentiment. Traders should monitor social media platforms like Twitter, Reddit, and Discord channels for hints of renewed enthusiasm. However, it is important to approach hype-driven rallies with caution, as they can fade just as quickly if underlying fundamentals remain weak.
Risk Management and Strategy
In a downtrending market, capital preservation becomes paramount. Traders can place stop-loss orders below key support levels (e.g., $0.25) to limit potential losses. If the market moves against them, these orders will automatically sell their positions, preventing a small loss from becoming a catastrophic one.
Avoiding Overexposure
Diversification is essential in the volatile world of meme coins. While the allure of quick gains can be tempting, it is generally advisable not to allocate more than a small percentage of your portfolio to high-risk assets like FARTCOIN. Overexposure can lead to substantial drawdowns, especially if the coin continues to decline.
Waiting for Confirmation
For those who believe in FARTCOIN’s long-term prospects, waiting for confirmation of a trend reversal can be prudent. This could include a break above a key resistance level (e.g., $0.40), a bullish moving average crossover, or a notable increase in positive volume. Jumping in too early during a strong downtrend can lead to “catching a falling knife,” a scenario where the price keeps dropping after you enter.
Final Words
FARTCOIN’s dramatic decline from $2.80 to $0.30 has raised serious doubts about the coin’s immediate future. The technical landscape appears bleak: FARTCOIN trades below its 5-day SMA of $0.32, remains only marginally above its 200-day SMA at $0.274, and has encountered higher selling volume than during its initial run-up. These factors collectively paint a picture of a market under persistent bearish pressure, with limited signs of a near-term rebound.
Yet, all hope is not lost. Meme coins are notoriously unpredictable, and a single positive catalyst—be it a social media campaign, a new listing, or a wave of speculative buying—can trigger a sudden reversal. Traders should keep an eye on potential support levels around $0.25 and $0.20, watch for shifts in volume from selling to buying, and look for bullish divergences in momentum indicators like the RSI and MACD. Until such signals emerge, caution is advised, as the path of least resistance remains downward.
For long-term believers in FARTCOIN, the key may lie in disciplined risk management. Using stop-loss orders, avoiding overexposure, and waiting for concrete signs of a reversal can help navigate these turbulent waters. While the coin’s current trajectory suggests more downside risk, markets can change rapidly—particularly in the meme coin arena. By staying informed, monitoring crucial price levels, and respecting the power of momentum, traders and investors can position themselves to either capitalize on a potential bounce or protect their capital if the decline continues.
In the end, FARTCOIN’s future will likely hinge on a combination of market sentiment, social media influence, and overall crypto market conditions. If a strong community remains and new interest emerges at lower prices, the coin could stage a comeback. If not, it may continue its descent, leaving many to wonder if FARTCOIN’s run was just another cautionary tale in the world of speculative cryptocurrencies.
Disclaimer: This article is for informational purposes only and should not be considered financial or investment advice. Always conduct thorough research and consult with financial professionals before making investment decisions.